Make a chart from your data
A chart in Mempipe is a file: a .vl.json file that holds a chart in Vega-Lite, an open format that other charting tools read too. Its data points at a CSV file or a saved SQL query in the same Space, so the chart shows the current data each time you open it. The quickest way to make one is to ask the in-app agent. You can also write the file yourself and upload it.
Before you start
Section titled “Before you start”You need data in the Space:
- A CSV or TSV file that opens as a table.
- Or, better, a saved
.sqlquery that returns exactly the rows to plot. A query can filter, join, and sort the rows first, which a chart can’t do.
Ask the agent to make a chart
Section titled “Ask the agent to make a chart”-
Open the agent.
Choose Agent in the right panel. First set up the agent with a model provider and API key, if you haven’t already.
-
Ask for the query and the chart.
Name the files you want, the data, and the kind of chart. For example:
Create
data/categories-by-function.sqlthat counts categories and subcategories per function frommp_table('./ai-rmf-categories.csv'). Then createdata/categories-by-function.vl.json, a bar chart of subcategories per function that reads that query.The agent saves the files without asking you first.
-
Open the chart.
Select the
.vl.jsonfile in Files. It opens in its visualization view. Point at a bar or point to see its values.
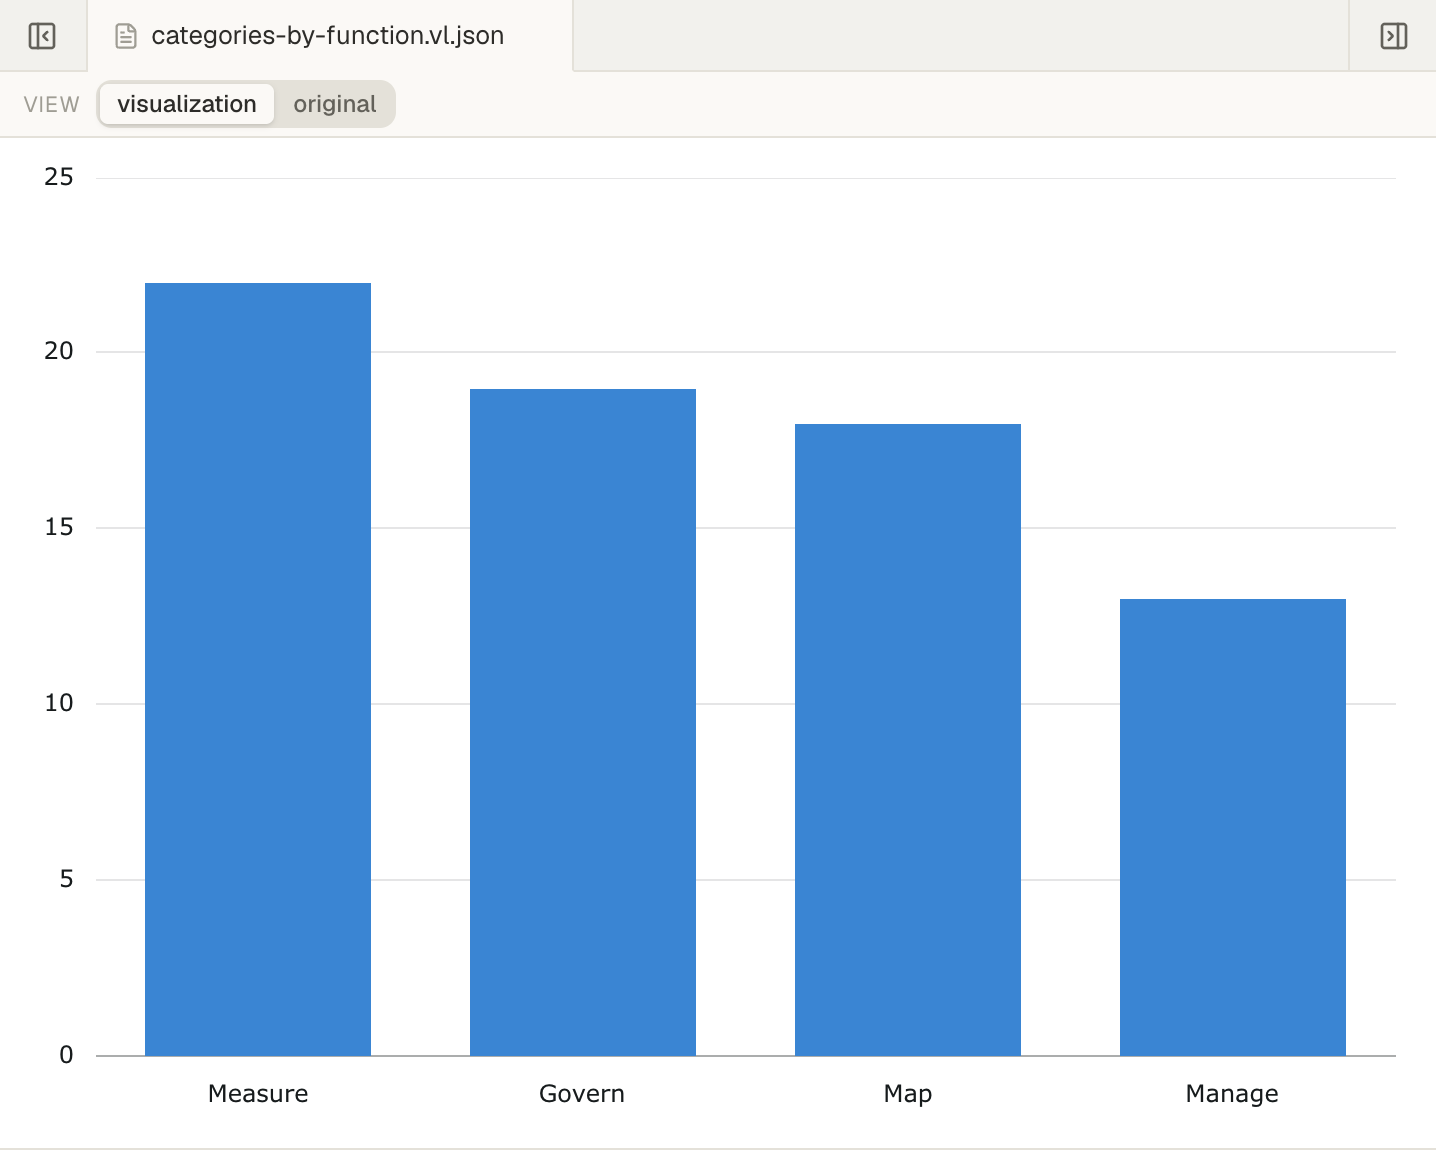
Check the chart against its data before you rely on it. Open the query or CSV file it reads and compare a few values.
Write a chart file yourself
Section titled “Write a chart file yourself”-
Write the chart.
In any text editor, write a Vega-Lite chart. This one draws a bar for each row of a saved query:
{"$schema": "https://vega.github.io/schema/vega-lite/v6.json","title": "Subcategories per function","data": { "url": "./categories-by-function.sql" },"mark": "bar","encoding": {"x": { "field": "function", "type": "nominal" },"y": { "field": "subcategory_count", "type": "quantitative" }}}Each
fieldmust match a column name in the data exactly. -
Save it with a
.vl.jsonextension.For example,
categories-by-function.vl.json. A plain.jsonfile doesn’t open as a chart. -
Upload it.
Upload the file to the folder that
data.urlexpects. Here, that is the folder holdingcategories-by-function.sql. -
Open it.
Select it in Files. It opens in its visualization view.
Point a chart at its data
Section titled “Point a chart at its data”The chart’s data goes in its data block:
"url": "./sales.csv"or"url": "./monthly.sql"names a file in the chart’s own folder."url": "data/sales.csv"names the path from the top of the Space."values": [ … ]puts the data inside the chart file itself. The chart then stays the same when other files change.
A chart that reads a .sql file runs the query each time the chart opens, and plots its result. A chart that reads a CSV file plots its rows as they are.
A name with no folder, such as "url": "sales.csv", doesn’t work: write "./sales.csv". Web addresses and other file types, such as JSON files, don’t load either.
What Mempipe can draw
Section titled “What Mempipe can draw”Mempipe draws a single chart from each file. It supports:
- Marks:
bar,line,area,pointfor a scatter plot, andarcfor a pie chart. - Channels:
xandy, and for a pie chart,thetafor the size of each slice andcolorfor its label. - Field types:
quantitativefor numbers,temporalfor dates, andnominalorordinalfor categories. - Time units:
year,yearmonth,yearmonthdate,month, andday, to group dates. - Aggregates:
sum,mean,count,min, andmax. - A title:
titleat the top of the file shows above the chart.
Mempipe ignores some parts of a chart, without an error:
- Axis titles and axis settings. The axes show no titles. An encoding’s
titlenames the value when you point at a mark. sort. Bars and points follow the order of the rows, so sort them in the query withORDER BY. A chart that usesaggregatesorts its groups by the grouped field instead, such as A to Z.- Tooltip settings. Pointing at a mark shows its label and value.
bin.
Bar, line, area, and point charts are drawn as a single series, so a color or size field doesn’t split them into one series for each value. When the chart uses aggregate, a color or size field without its own aggregate still splits the totals. For example, a chart of total amount per month with "color": { "field": "region" } gets one total for each month and region, drawn in the same colour at the same month. Leave color and size out of these charts. For one total per month, keep the aggregate without color, or total the rows per month in a SQL query and chart its result.
Charts built from several views, with layer, concat, hconcat, vconcat, facet, or repeat, don’t draw, and nor do charts with a transform list or params. They show Mempipe’s renderer doesn’t support this spec, with the reason. The file is still valid Vega-Lite, so other tools, such as the Vega Editor, Observable, and Altair, can draw it. To draw a chart with a transform in Mempipe, do the calculation in a SQL query instead and plot its result.
Change a chart
Section titled “Change a chart”Mempipe can’t show or edit the text of a chart file: its original view says No preview available for this file type. To change a chart, do one of these:
- Ask the agent to change it, for example: “In
data/categories-by-function.vl.json, make it a line chart.” The agent reads the file, changes it, and saves it. - Edit the file on your computer and upload it again, choosing Replace.
A chart reads its data when it opens. It doesn’t redraw by itself when the data changes. To see new data, close the chart’s tab and open it again. If the change was made in another browser tab or by a connected AI assistant, reload the page first.
Show a chart in a note
Section titled “Show a chart in a note”To show a chart inside a Markdown note, add an embed on a line of its own, such as ![[categories-by-function.vl.json]]. The chart reads its data each time the note opens. Write and edit Markdown notes explains how embeds find a file.
If something goes wrong
Section titled “If something goes wrong”- Could not parse chart spec. The file isn’t valid JSON. The message below it says where the problem is, such as a missing comma or quote.
- Mempipe’s renderer doesn’t support this spec. The chart uses a feature or mark Mempipe can’t draw, or lacks a field it needs, such as
xandy, orthetaandcolorfor a pie chart. The message names the problem, and What Mempipe can draw lists what works. - Could not load chart data. The message below it says why:
- Data file not found names the path the chart looked for. Check the file’s name and folder.
- Bare-name
data.urlreferences aren’t supported means the path has no folder. Start it with./. - Unsupported data file format means the data isn’t a CSV, TSV, or
.sqlfile. - Data target is not a file means the path names a folder.
- Could not parse data file means the CSV or TSV file couldn’t be read.
- Named data sources (
data.name) aren’t supported yet andmempipe:URL scheme isn’t supported mean thedatablock uses a form Mempipe doesn’t read. Useurlwith a path, orvalues. - A message that quotes
mp_table()or a query error comes from the saved query. Open the.sqlfile to see the error and fix it. If a query fails lists the common ones.
- The chart is empty or has blank values. Check that each
fieldmatches a column name exactly, and that the data has rows. AnaggregateortimeUnitthat isn’t listed in What Mempipe can draw, such asmedianorquarter, leaves its values blank without an error. - The chart’s data looks wrong, but the table looks right. A chart that reads a CSV file directly doesn’t look for the table inside it the way the tables view does, so title lines above the table can confuse it. Point the chart at a saved query that reads the CSV instead.
- row-capped result — the chart may be partial appears above the chart. The query returned more than 10,000 rows, so the chart shows only the first 10,000. Group or total the rows in the query.
- stale — re-deriving appears above the chart. A file the query reads has just changed. Open the chart again in a few seconds.
- stale appears above the chart. The chart shows data from an earlier version of a file the query reads. Open the chart again later for the latest data.
- last derivation failed — showing previous appears above the chart. Mempipe couldn’t read the newest version of a file the query reads, so the chart shows the version before it. See A file is stuck processing or failed.